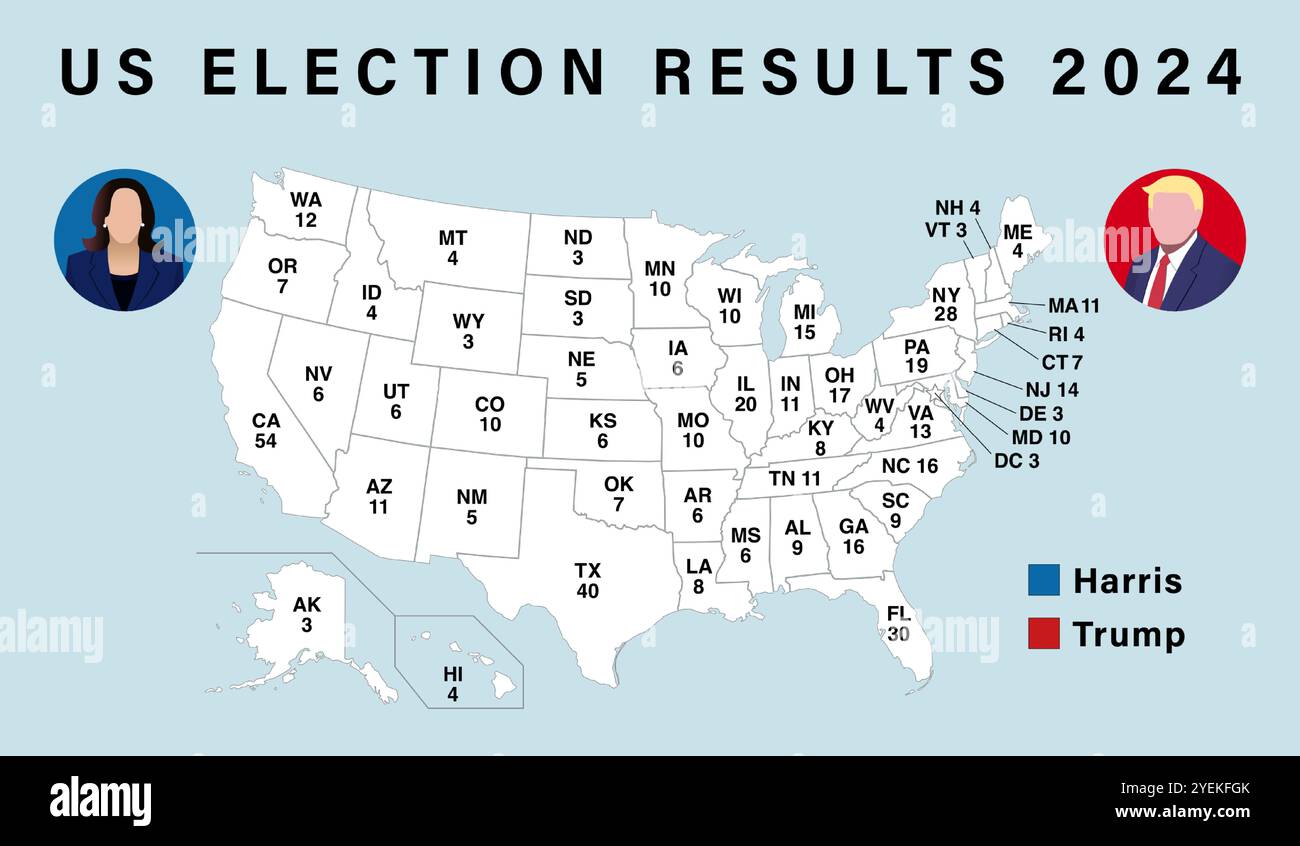
Honestly, if you just glance at the 2024 voting results map, you see a whole lot of red. That’s the obvious part. Donald Trump locked up 312 electoral votes, leaving Kamala Harris with 226. But if you think this was just another "standard" Republican win, you’re kind of missing the real story buried in the data.
The map didn’t just tip; it practically inverted in places nobody expected.
We’re talking about a massive shift where over 90% of U.S. counties moved toward the right compared to 2020. That isn't just a "swing"—it’s a geographic overhaul. Even in deep-blue strongholds like New Jersey and New York, the margins tightened so much it made political consultants choke on their coffee. Trump didn’t just win the swing states; he changed the math of the entire country.
The Swing State Sweep: Why the Blue Wall Crumbled
Everyone was obsessed with the "Blue Wall"—Pennsylvania, Michigan, and Wisconsin. For months, pundits argued these states were Harris’s best shot. They weren't.
Trump took all three.
In Pennsylvania, the margin was about 2 percentage points. Not exactly a landslide, but in a state that saw billions in ad spending, it felt like a mountain. Michigan was even tighter, with a gap of roughly 1.4%. The "uncommitted" movement in Michigan, largely driven by dissatisfaction over foreign policy in Gaza, clearly ate into the Democratic base.
Then you’ve got the Sun Belt.
Arizona and Nevada, which Biden flipped in 2020, went back to Trump. Nevada was particularly wild because it hadn't voted for a Republican presidential candidate since 2004. Trump’s "no tax on tips" pitch resonated in a state where the service industry is basically the entire economy. It worked.
The 2024 voting results map and the Latino Shift
This is where things get really interesting. If you look at the 2024 voting results map at a county level, look at the Rio Grande Valley in Texas.
Maverick County is the one everyone is talking about. It’s a majority-Latino border county that Joe Biden won by double digits in 2020. In 2024? Trump won it by about 28 points. That is a statistical earthquake.
It turns out, the "demographics are destiny" argument—the idea that a more diverse America would naturally become more Democratic—took a massive hit. Trump won about 46% of the Latino vote nationally. According to Pew Research, he actually won 55% of Latino men.
Economic anxiety was the great equalizer here. People were tired of paying $5 for a dozen eggs, and they didn't care about the traditional party lines anymore.
Surprising Red Shifts in Blue Havens
- Florida: No longer a swing state. Trump won Miami-Dade by 11 points, the first Republican to win there since 1988.
- New Jersey: Harris won, but by only about 6 points. Biden won it by 16 in 2020.
- New York City: Trump pulled roughly 30% of the vote in his home city. That’s the best a Republican has done since Reagan.
Gender, Age, and the Rogan Effect
We spent all year hearing about the "gender gap," and it was definitely there. Women backed Harris by about 7 or 8 points, while men backed Trump by 12 or 13. But the real shocker was the youth vote.
Voters under 30 still leaned toward Harris, but the margin was tiny compared to previous years. In 2020, Biden won this group by 24 points. In 2024, Harris only held them by about 4 to 6 points, depending on which exit poll you trust.
Young men, in particular, moved toward Trump in droves.
You can't talk about this without mentioning the "Manosphere" or the Joe Rogan effect. The campaign leaned hard into podcasts and alternative media, reaching guys who don't watch evening news. It paid off. Men under 30 went for Trump by double digits in some battleground areas.
What the Data Actually Tells Us
The 2024 voting results map shows a country that is less divided by "North vs. South" and more divided by "City vs. Everywhere Else."
Rural areas became even redder, with Trump pulling nearly 70% of the vote in those communities. Meanwhile, the Democratic gains in the suburbs—which were supposed to be their secret weapon—sorta stalled out. In some places, like the Atlanta suburbs, Democrats did okay, but it wasn't enough to offset the losses in the rest of Georgia.
What we are seeing is a "class inversion."
The Democratic Party is becoming the party of the highly educated, college-degree-holding professionals. The Republican Party is becoming a multi-racial, working-class coalition. That is a total flip from how things looked thirty years ago.
Moving Beyond the Map: Practical Insights
If you’re trying to make sense of where the country goes from here, don't just look at the colors on the map. Look at the "why."
- Inflation is the Ultimate Voter: Regardless of social issues, the price of gas and groceries decided this election. Any future candidate who ignores the "kitchen table" economy is doomed.
- The "Information Silo" is Real: The shift toward podcasts and social media means traditional TV ads are losing their power.
- No Group is a Monolith: The 2024 results proved that you cannot count on any racial or age group to vote as a block.
The most important thing to do now is look at your local county data. National maps are great, but the real story of 2024 is in the thousands of tiny shifts in small towns and city neighborhoods. You can find these breakdowns on official Secretary of State websites for each state. Comparing your county’s 2020 performance to 2024 will tell you more about the future of American politics than any pundit on a screen.
Actionable Next Steps:
To see exactly how your neighborhood changed, visit the Federal Election Commission (FEC) website for official certified totals or check the MIT Election Data and Science Lab. These sources provide the raw CSV files that allow you to filter results by precinct, giving you a much clearer picture of the 2024 voting results map than the simplified versions seen on news sites.